Our system provides customers with the ability to not only save money, use less energy, but also help out the environment.
In the past, we have been asked how our particular system works and what attributes make it as effective as it is. The system we use gives real-time results of solar production, building’s usage, individual’s system usage, etc.
If a solar panel becomes defective, the system detects that and we know exactly which one it is, and can address the problem immediately (solar panels are warrantied for 25 years, so just need the manufacturer to replace it). This system also allows us to predict your utility bills and can forecast bills based on weather patterns.
In this blog, we will address a few key questions that pertain to the system we use.
Does Our System Monitor A Building’s Real Time Demand Curve?
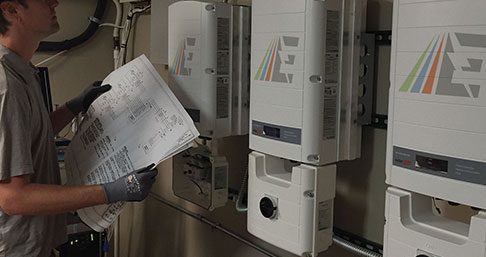
The SolarEdge portal displays real-time data for the live production in kW, as well as tracks the total kWh produced over time.
The Honeywell hardware that we use for automation can track the building’s demand curve in real time, and can also track data over the course of week, month, year, etc.
This hardware can also be configured to track the demand and consumption of individual pieces of equipment, such as rooftop HVAC units.
Does This Allow Us To Predict Customer Monthly Bills?
Absolutely, but you have to have a good understanding of how your utility provider’s rate structure works.
That’s a big part of our core skill set- understanding how you are billed, and then designing the automation system to utilize the rate structure your building is in, or in some cases, force it into a more beneficial rate structure if possible.
Simply put, our system allows us to predict your utility bills while giving us the ability to use our expertise to forecast bills based on weather patterns.
