The state of California is currently dealing a unique situation with their grid called the “Duck Curve.”
The Duck Curve, which was recently brought to the table, has a historic opportunity to modernize the grid while encouraging innovation and creative thinking.
What is the Duck Curve?
The “duck curve” graph, as it’s known in energy circles, shows the gap between the total load a utility serves and what the load looks like after wind and solar generation serve some of that load.
It gets its name from the graphic interpretation of that scenario because it looks somewhat like a sitting duck.
It represents an average day, rather than a peak demand day.
The duck curve is proof of the growing industry’s ability to meet early afternoon peak power demand.

Those working in the fields of efficiency, storage, or demand response, recognize the curve as an opportunity to prove your value during fast-ramping periods in the late afternoon. Those working for a utility or regulatory agency, have been presented a difficult challenge because the curve strains the grid, threatens profits, and challenges everything the old system and model did.
What’s the future of the Duck Curve?
The duck curve situation is pretty solvable looking into the future.
A set of proven strategies can “teach” the duck to fly. These strategies tighten the duck’s belly and flatten its neck, thus moving it from a “sitting duck” position to a “flight” pose, thereby helping solve one of the more pressing problems facing the solar power sector.
Over time, we have learned a lot about the grid and how far it has come to date.
It is more convincing now than ever before, that the duck curve presents a historic opportunity to modernize the grid, increase the penetration of pollution-free, clean energy resources, and make our homes, buildings, and businesses more energy efficient in the long-run
10 Ways to Address the Duck Curve
California has come up with 10 ways to help in solving the issues set out by the duck curve and we have listed them for you below:
- Target energy efficiency to the hours when load ramps up sharply
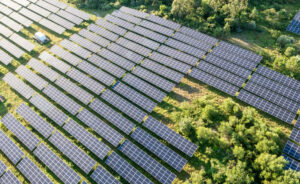
- Orient solar panels to the west
- Substitute solar thermal with a few hours of thermal storage in place of some projected solar PV generation
- Implement service standards allowing the grid operator to manage electric water heating loads
- Require new air conditioners to include two hours of thermal storage capacity under grid operator control.
- Retire inflexible generating plants with high off-peak, must-run requirements
- Concentrate utility demand charges into the “ramping hours” to enable price-induced changes in load
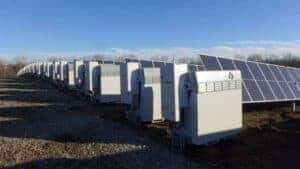
- Deploy electrical energy storage in targeted locations
- Implement aggressive demand-response programs
- Use interregional power exchanges to take advantage of diversity in loads and resources